Nice Tables in LaTex
A simple tutorial for making nice LaTex tables directly from STATA.
Tables using esttab
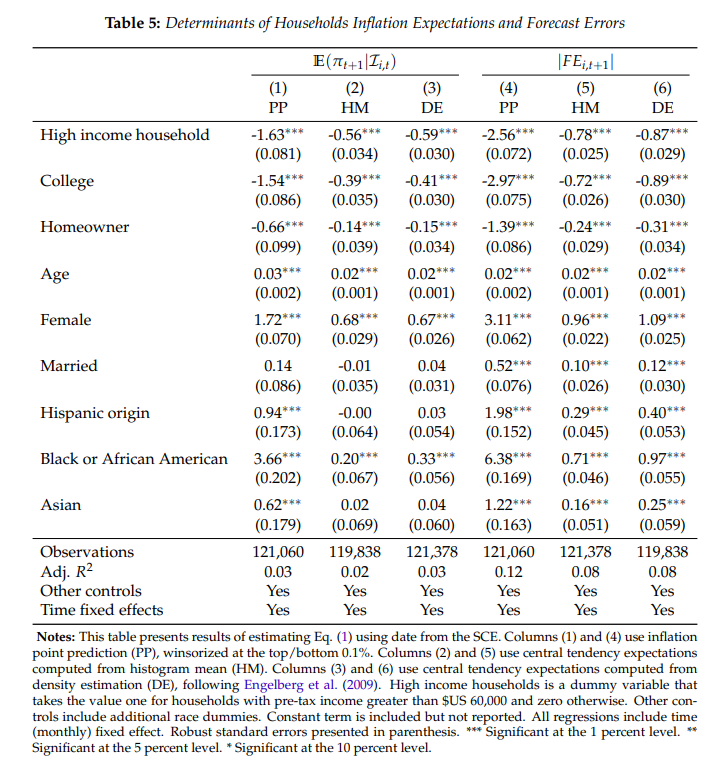
This is probably the most common command for computing LaTex tables. For most common cases it works rather well, and is much faster than texdoc (see below). Here is an example of the options I typically use to get nice tables using esttab
	estimates clear
	foreach yvar of varlist inflation_exp* FE_* {

		qui eststo: reghdfe `yvar' homeowner high_income_house college age gender married hispanic_origin i.race, abs(date) vce(r)
		estadd local time_FE "Yes"
		estadd local other_controls "Yes"
		estadd scalar a_r2 = e(r2_a)
	}

	esttab using "$tables/determinants_inflation_exp.tex", width(\hsize) nocons b(%5.2fc) se(%5.3fc) star(* 0.1 ** 0.05 *** 0.01) ///
			obslast nonotes nobaselevels replace booktabs substitute("\_" "_")  ///
			mtitles("PP" "HM" "DE" "PP" "HM" "DE") ///
			coeflabels(high_income_house "High income household" college "College" homeowner "Homeowner" age "Age" gender "Female" ///
			married "Married" hispanic_origin "Hispanic origin" 2.race "Black or African American" 4.race "Asian") ///
			order(high_income_house college homeowner age gender married hispanic_origin 2.race 4.race) drop(_cons 3.race 5.race 6.race) ///
	        mgroups("\$ \mathbb{E}(\pi_{t+1}|\mathcal{I}_{i,t}) \$" "\$ |FE_{i,t+1}| \$", pattern(1 0 0 1 0 0) ///
	        prefix(\multicolumn{3}{c}{) suffix(}) span erepeat(\cmidrule(lr){@span}))            ///
	        stats(N a_r2 other_controls time_FE, labels(Observations "Adj. \$ R^{2} \$" "Other controls" "Time fixed effects") fmt("%9.0fc %9.2fc"))
Tables using texdoc
Using the command texdoc (ssc install texdoc) allows editing latex tables within a STATA do-file. This is very useful to have easily replicable results with no intermediate formatting of the table (e.g.
tablegenerator.com).
Here some notes.
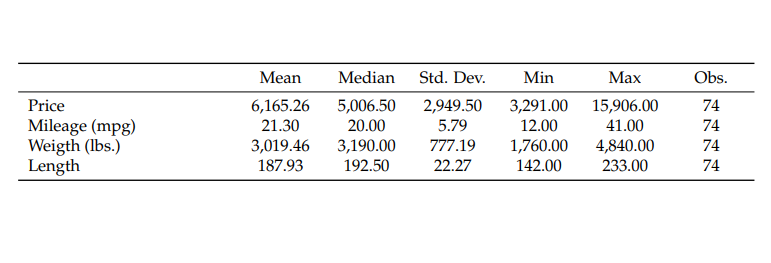
Basically you must store results in macros, and then add ‘fill’ your latex table manually (e.g. with a loop). Here a simple example for a descriptive stats table
    global tables = "C:\Users\LR\Desktop\Lucas Rosso\lucas-rosso.github.io\resources_LR"
    sysuse auto, clear

    foreach var of varlist price mpg weight length {
        local `var' = ""
        summ `var', detail

        foreach stat in "mean" "p50" "sd" "min" "max" "N" {

            if "`stat'" != "N" local aux: di %9.2fc r(`stat')
            else local aux: di %9.0fc r(`stat')

            local `var' = "``var'' & `aux'"
        }
    }

    texdoc i "$tables\desc_stats.tex", replace force
    tex \begin{tabular}{m{14em}*{6}{>{\centering\arraybackslash}m{1.4cm}}} \toprule
    // tex  & \textbf{Mean} & \textbf{Std. Dev.}  & \textbf{Min}  & \textbf{Max} & \textbf{Obs.} \\ \midrule
    tex  & Mean & Median & Std. Dev.  & Min  & Max & Obs. \\ \midrule
    tex Price `price'           \\
    tex Mileage (mpg) `mpg'     \\
    tex Weigth (lbs.) `weight'  \\
    tex Length `length'         \\ \bottomrule
    tex \end{tabular}
    texdoc close
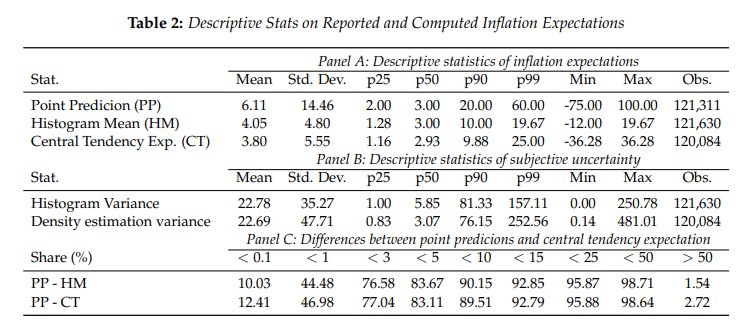
Below there is a more complex example with multiple regressions, panels, etc which allows to get a grasp of the things one can do with this command. The great advantage is that, even though it takes longer, once you made the table, it is straightforward to change things and everything is easily replicable.